
Query Queues are set up in Redshift Workload Management and are designed to give the administrator freedom to assign more or fewer resources to given groups or users. On occasion, you will need to inspect these queues to see which queries are running in which queues for troubleshooting purposes or for optimization.
Create Required Views
You will need to create the two views below in order to inspect your query queues. WLM_QUEUE_STATE_VW shows each queue in WLM and how many slots it has. WLM_QUERY_STATE_VW tells you what query is running and in which queue.
WLM_QUEUE_STATE_VW
CREATE VIEW WLM_QUEUE_STATE_VW AS

SELECT(config.service_class-5) AS queue

, trim (class.condition) AS description

, config.num_query_tasks AS slots

, config.query_working_mem AS mem

, config.max_execution_time AS max_time

, config.user_group_wild_card AS "user_*"

, config.query_group_wild_card AS "query_*"

, state.num_queued_queries queued

, state.num_executing_queries executing

, state.num_executed_queries executed

FROM

STV_WLM_CLASSIFICATION_CONFIG class,

STV_WLM_SERVICE_CLASS_CONFIG config,

STV_WLM_SERVICE_CLASS_STATE state

WHERE

class.action_service_class = config.service_class

AND class.action_service_class = state.service_class

AND config.service_class > 4

ORDER BY config.service_class;
WLM_QUERY_STATE_VW
CREATE VIEW WLM_QUERY_STATE_VW AS

SELECT query, (service_class-5) as queue, slot_count,
 trim(wlm_start_time) as
start_time, trim(state) as state, trim(queue_time) as queue_time,
trim(exec_time) AS exec_time

FROM stv_wlm_query_state;
Useful Statements
Disable Result Cache
SET enable_result_cache_for_session to off;
Disables query cache so your queries have consistent execution times.
Change Query Group
SET query_group TO [query group name];
Sets the current query_group to the one designated.
Reset Query Group
RESET query_group;
This resets the current query_group back to the default.
Switch Account
SET SESSION AUTHORIZATION '[username]';
This allows you to change users so you can run different queues based on the username.
Inspecting the Query Queue
The query queue is a list of all the queues you’ve set up in Workload Management. If you haven’t set up any queues, then you will see only two, the default queue and the superuser queue.
SELECT * FROM
wlm_queue_state_vw;
This is the default queue setup and what you would see on a stock Redshift cluster:

Here is what a custom queue would look like:
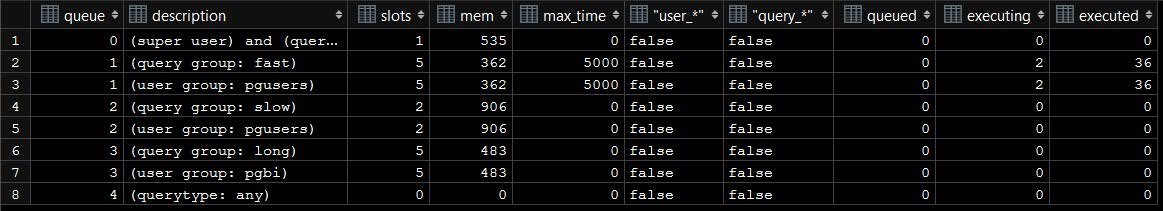
The custom queue is a three-queue setup that allows for a timeout (max_time) on the fastest queue and moves anything slower to a second queue. The third queue is for the user group pgbi (analytics queries) only.
The queues in the result set are a little redundant. You can filter to see the queues by user group or query group by filtering on the description column.
SELECT *

FROM wlm_queue_state_vw

WHERE description like '%query%'
Inspecting the Query State
The query state view allows you to inspect every running query and in which queue and slot it is running. From this point, you can get the query id and use that to dig deeper into a query.

Because I am in the pgusers group, this query ran in queue 1 and slot 1.
If I switch users and run a query from the pgbi group, this is the result:
SET SESSION AUTHORIZATION 'pgbiuser';

It’s important to remember that when you create custom queues, you must create the groups that you assign on the queues. You can then add users to these groups and give them permission to tables or schemas. You can also assign users to specific queues in Workload Management.
You can find additional information about queue behavior here: