
Table of contents
Using pg_stat_statements, we’ll look at several ways to identify queries with slow response times and those that are heavily used. If you’re not familiar with how to enable pg_stat_statements, please see my other blog.
Slow Queries
In the pg_stat_statements table, there are several columns, which I will focus on. These metrics will help you identify which queries have a high response time. These metrics are based on when the pg_stat_statements table was last reset, if you’re postgresql.conf has “pg_stat_statements.save” set to off, your table will reset every time you restart the server.
Columns:
calls – The total number of times the query has been executed since pg_stat_statements was reset.
total_time – The total combined execution time for all calls
query – The query text that was executed
Let’s execute an aggregate query to find out which queries are responding the slowest. To do this, we want to divide the total_time by the total number of calls. This will give us the average response time of each query in milliseconds.
select query, calls, (total_time/calls)::integer as avg_time_ms
from pg_stat_statements
where calls > 1000
order by avg_time_ms desc
limit 100;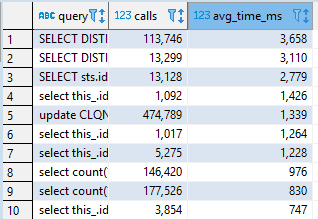
The predicate “where calls > 1000” is used to isolate only queries that are used most often, this will ignore ad hoc queries and focus on those that are used regularly in your application. From this list, you can decide which of these are not meeting response time thresholds.
One other predicate I like to add to this query:
select query, calls, (total_time/calls)::integer as avg_time_ms
from pg_stat_statements
where calls > 1000
and rows < 5000
order by avg_time_ms desc
limit 100;
I add the “and rows < 5000” predicate to determine which queries are taking a long response time and returning small amounts of data. I understand this can sometimes lead to false positives depending on the complexity of the query, but it’s another tool to use in your investigation.
Multi-Tenant Queries
If you’re hosting a multi-tenant application/database, then you’ll quickly find out that you’ll have duplicate entries in your pg_stat_statements table. There currently isn’t a way to know which schema the query is coming from, but you can group these queries to get an idea of which ones are being troublesome across each tenant.
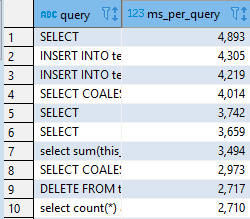
Using a CTE
with timeperquery as
(
select query, (calls/total_time) as ms_per_call
from pg_stat_statements
where rows != 0
)
select query, sum(ms_per_call)::integer as ms_per_query
from timeperquery
group by query
order by ms_per_query desc
This will give you the queries with the highest response times across all tenants.
Hot Queries
Hot queries need to be identified, so you’re familiar with the most active areas of your database. Once you identify these hot spots, you can determine what the impact will be if something were to go wrong or ways that you can improve the most used portions.
If you have a query that is executed 1000 times in 650ms per call and you’re able to optimize that query down to 300ms per call, you’re saving 350 seconds of execution time. If there is another query that runs 100,000 times in 100ms, but you can optimize it to 80ms, you’re saving 2,000 seconds of execution time. It’s not always the largest response time that is going to have the most effect from a utilization perspective.
Of course, optimization is usually driven by end-user expectations, but it’s a valid concern either way.
select
	query,
	calls,
	total_time::integer,
	(calls/total_time)::integer as ms_per_call,
	shared_blks_hit,
	shared_blks_read
from pg_stat_statements pss
order by calls desc
limit 10;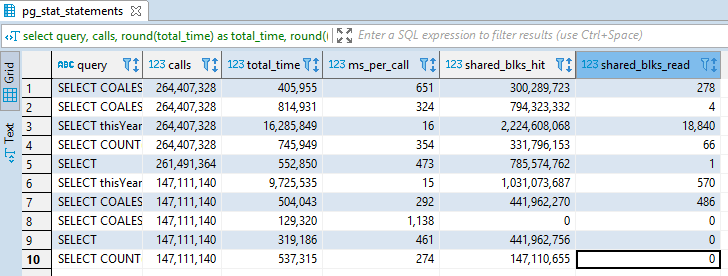
This top 10 list shows us the hottest queries being executed the most times against the database. We can divulge from this list that there are several hot queries that have less than desirable response times for the amount of times they’re executed. The shared_blks_hit compared to shared_blks_read tells us that data is being properly pulled from the cache.
There are many ways to use this information to determine how your database is running. It will also give you information pertaining to what you can troubleshoot if your queries are slow.
Please utilize my other blogs to help you with your PostgreSQL performance issues.