The most important function of a database is returning queries in an acceptable response time. Sometimes these response times do not meet expectations, and it’s important to know where to look to find out more information. Utilizing a built-in extension called pg_stat_statements, we can use calculations to determine many things about queries the database is processing.
Using pg_stat_statements
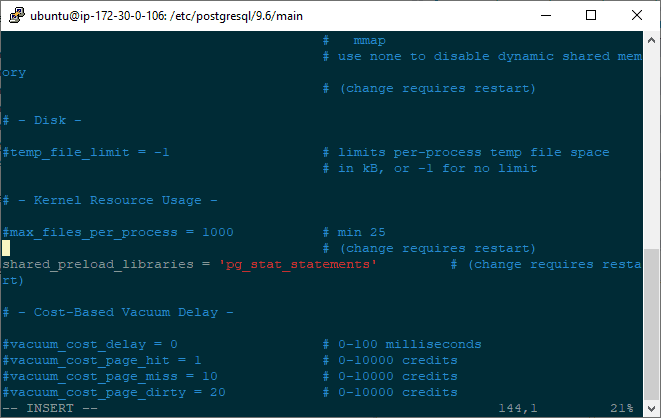
Before you can use pg_stat_statements extension, you have to enable it in your config file and restart your instance.
Open your postgresql.conf and edit the line shared_preload_libraries and add pg_stat_statements.
The default location of your postgresql.conf file on ubuntu is : /etc/postgresql/9.6/main
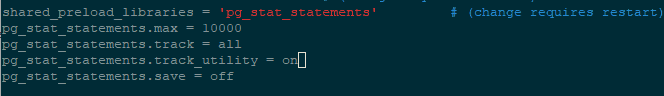
Before you save the file, let’s look at some other options offered by the extension to customize how it behaves.
pg_stat_statements.max – sets the max number of statements PostgreSQL will keep track of.hink of this as rows in the pg_stat_statements table. The Default is 5000.
pg_stat_statements.track – Default is top.
- all – Tracks all statements, including those inside function calls
- top – Tracks only statements issued by clients
- none – disable collection
pg_stat_statements.track_utility – On or Off . Tracks whether or not queries besides just SELECT, UPDATE, DELETE AND INSERT queries are tracked. Default is on.
pg_stat_statements.save – On or Off. This sets whether the data should reset when the instance restarts, setting to off will reset the pg_stat_statements table after instance restart.
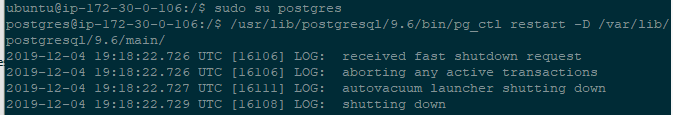
Switch to the postgres user and restart the database.
Next, you will need to create the extension.
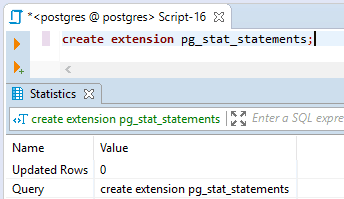
If this is your first time creating the extension, you will have to allow some time for the table to populate query data to get a good representation of how your queries are performing.
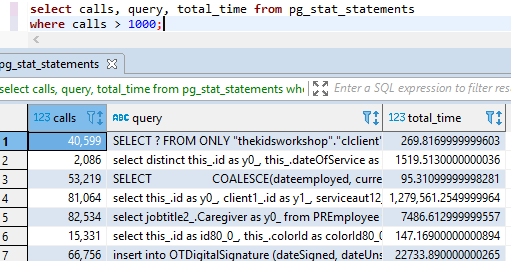
However, you can select from the table right away.